While we have known for some time that bicycle infrastructure leads to more people on bicycles, recent research published in Nature Cities quantified the amount that protected bicycle lanes increase roadway use by people on bicycles. This study, conducted in 28 different cities in the United States, found that more people ride bicycles and that people ride farther when there are protected bicycle lanes. Continue reading Low Stress Bicycle Facilities Increase Bicycle Use as Transportation
Author: News Letter
Economics and Bicycling in Arizona
As people involved in bicycle advocacy, we often hear people who don’t support active transportation talking about bicycle infrastructure as if it adds no value or creates some sort of burden on our communities.
This article provides responses to some of those statements.
FHWA Bike Lanes on Higher Speed Roads Summary
In June of 2024, the Federal Highway Administration (FHWA) released their guidance on Separated Bike Lanes on Higher Speed Roadways: A Toolkit and Guide. The guide can be helpful for advocates and transportation planners in understanding how to promote and plan for the appropriate types of bicycle facilities on higher speed roadways. In this article, the Coalition of Arizona Bicyclists has summarized that guide. Continue reading FHWA Bike Lanes on Higher Speed Roads Summary
Arizona Bicycle Organizations – Volunteer and Riding Opportunities
Are you looking for bicycle advocacy or volunteer opportunities in your community or at the state or regional level?
Or are you looking for more opportunities to ride your bicycle?
The Coalition of Arizona Bicyclists has compiled a list of advocacy groups, community organizations, and bicycle clubs. Continue reading Arizona Bicycle Organizations – Volunteer and Riding Opportunities
Stop as Yield aka “The Idaho Stop”
The Idaho Stop is the common name for any law that allows people who are riding bicycles to treat a stop sign as a yield sign, and/or a red traffic signal as a stop sign.
It is often referred to as the Idaho Stop as Idaho was the first state to adopt the law. Examples of existing laws are shown in the appendix below.
States with Stop as Yield Laws in Place
Arkansas Effective 2019
Colorado Effective for Local Decision in 2018, State Law 2022
Delaware* Effective 2017
Idaho Effective 1982
Minnesota* Effective 2023
North Dakota* Effective 2021
Oklahoma Effective 2021
Oregon* Effective 2020
Utah* Effective 2021
Washington* Effective 2020
Washington DC* Effective 2022
*Stop sign as yield only, not stop light
States Considering Stop as Yield Laws in Recent Years
California AB73
New Jersey A 1541 Title 39
New York S 920 1231-a
Virginia HB 2262 46.2-903.1
CalBike “Bicycle Safety Stop” Efforts
There have been efforts in California over the last few legislative cycles in enact this law without success. The California Bicycle Coalition (CalBike) is one of the groups pursuing the “Bicycle Safety Stop” Law in 2023. This would allow people on bicycles to treat a stop sign as a yield sign, and would require traffic control signals be obeyed. CalBike created this video to explain the stop as yield process. https://www.calbike.org/bicycle-safety-stop-law/
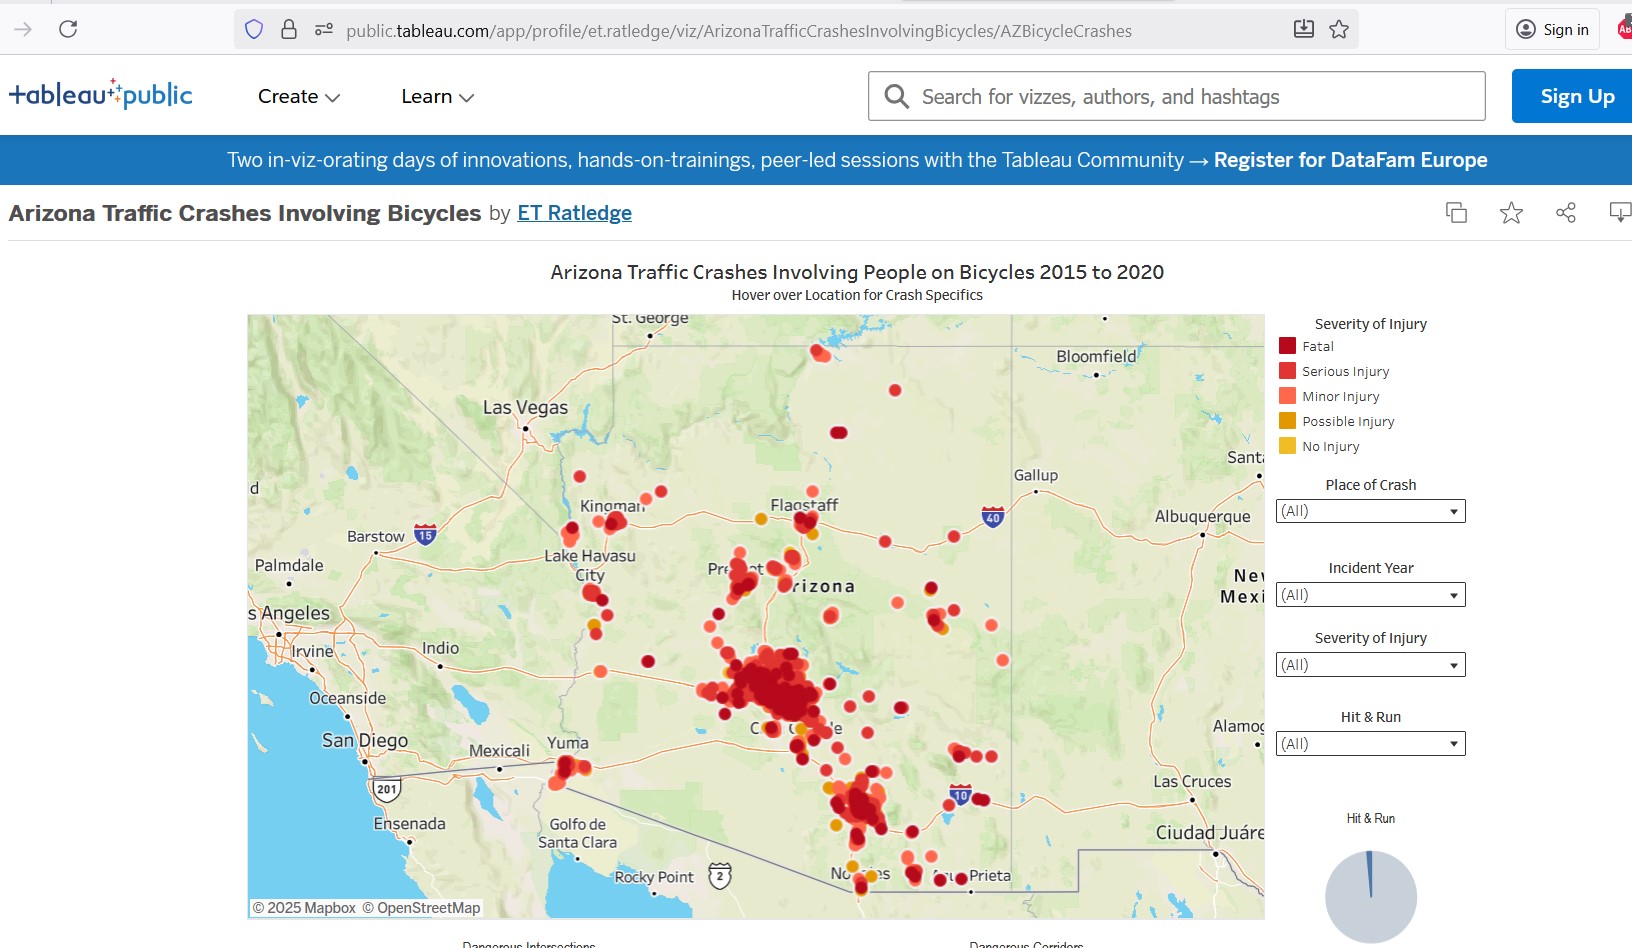
Impact Study Results
Studies in Idaho and Delaware show significant decreases in crashes at stop-controlled intersections after the law was put in place.
Idaho – Bicycle injuries from traffic crashes declined 14.5%
Delaware – Traffic crashes involving bicycles at stop sign intersection declined 23%
NHTSA Fact Sheet
In their document Bicycle “Stop-As-Yield” Laws and Safety Fact Sheet, the National Highway Traffic Safety Administration included the following statements:
“Bicyclist stop-as-yield laws allow cyclists to mitigate risk to their advantage, increase their visibility to drivers and reduce exposure.”
“[T]here is no evidence showing bicyclist stop-as-yield laws have increased bike conflicts with other bikes or pedestrians.”
“When bicyclists can maintain a safe but precautionary momentum through an intersection, it allows continuous traffic flow.”
Ad Hoc National Stop as Yield Group
There is an ad hoc group of Stop as Yield advocates coordinated through CalBike. There are currently representatives from California, Illinois, New York, Virginia, Michigan, Texas, Colorado, Utah, North Dakota, League of American Bicyclists, and DC. If interested contact Walt ‘The Bike Guy’ at bikeguy@surewest.net
Current Arizona Law
- Bicyclists riding in the road have the rights and duties of the driver of any non-motorized vehicle (§28-812)
- The stop sign law (§28-855) and traffic control signal law (§28-645) require any driver of a vehicle (include non-motorized) to stop
- Law does allow one to stop and ‘proceed with caution only when it is safe’ if the traffic signal is inoperable (§28-645) with mixed results for bicycle riders as a defense in court
- Arizona does allow some local regulation of bicyclists, provided that ‘additional traffic regulations that are not in conflict’ with state law. (§28-627 §28-626)
The Coalitions of Arizona Bicyclists interpretation is that local ordinance cannot legalize Stop as Yield, and that state law change would be required. (This is not a legal opinion.)
Do you think stop as yield would be a good thing for people who ride bikes in Arizona?
Let us know by commenting below.
Appendix
Examples of Stop as Yield Laws
Idaho
49-720. Stopping — Turn and stop signals. (1) A person operating a bicycle, human-powered vehicle, or an electric-assisted bicycle approaching a stop sign shall slow down and, if required for safety, stop before entering the intersection. After slowing to a reasonable speed or stopping, the person shall yield the right-of-way to any vehicle in the intersection or approaching on another highway so closely as to constitute an immediate hazard during the time the person is moving across or within the intersection or junction of highways, except that a person, after slowing to a reasonable speed and yielding the right-of-way, if required, may cautiously make a turn or proceed through the intersection without stopping.
(2) A person operating a bicycle or human-powered vehicle approaching a steady red traffic control light shall stop before entering the intersection and shall yield to all other traffic. Once the person has yielded, he may proceed through the steady red light with caution. Provided however, that a person, after slowing to a reasonable speed and yielding the right-of-way, if required, may cautiously make a right-hand turn. A left-hand turn onto a one-way highway may be made on a red light after stopping and yielding to other traffic.
(3) A person riding a bicycle shall comply with the provisions of section 49-644, Idaho Code.
(4) A signal of intention to turn right or left shall be given during not less than the last one hundred (100) feet traveled by the bicycle before turning, provided that a signal by hand and arm need not be given if the hand is needed in the control or operation of the bicycle.
History:
[49-720, added 1988, ch. 265, sec. 209, p. 679; am. 2005, ch. 205, sec. 1, p. 615; am. 2019, ch. 84, sec. 6, p. 209.]
https://legislature.idaho.gov/statutesrules/idstat/title49/t49ch7/sect49-720/
Washington, DC
A rider approaching a stop sign may go straight through the intersection or make a turn without stopping; provided, that the rider:
(1) Is traveling at an appropriate speed to reasonably assess and avoid hazards;
(2) Determines there is no immediate hazard; and
(3) Yields the right-of-way to pedestrians and to other traffic lawfully using the intersection.”
Minnesota
Subd. 4a.Stopping requirements.
(a) For purposes of this subdivision, “in the vicinity”
means located in an intersection or approaching an intersection in a manner that constitutes a hazard of collision during the time that a bicycle operator would occupy the intersection.
(b) A bicycle operator who approaches a stop sign must slow to a speed that allows for stopping before entering the intersection or the nearest crosswalk. Notwithstanding subdivision 1 and section 169.06, subdivision 4, if there is not a vehicle in the vicinity, the operator may make a turn or proceed through the intersection without stopping.
(c) Nothing in this subdivision alters the right-of-way requirements under section 169.20.
The provisions under this subdivision do not apply when traffic is controlled by a peace officer or a person authorized to control traffic under section 169.06.
Here’s a List of Organizaations that Have Bicycles for People Who Need Them
While the Coalition of Arizona Bicycles doesn’t provide bicycles, there are groups throughout Arizona that refurbish bicycles and provide them to people who need bikes. These groups provide bicycles for adults and children. Some of these groups provide shop space for doing repairs, earn-a-bike programs, repair and maintenance instruction, and more. These groups have opportunities for volunteers and are often looking for donations of bicycles, parts, tools and/or cash.
Coconino County https://www.facebook.com/photo/?fbid=730728779081216&set=a.304668665020565
- Coconino County Health and Human Services
Bicycles for people that need them for transportation
Flagstaff
- Lefty Loosey Bike Co-op https://www.leftylooseybikes.org/about
Donates refurbished bikes to people in need
Repair space with tools
Bicycle repair and maintenance instruction
Fountain Hills
- Bob’s Free Bikes https://www.bobsfreebikes.org/
Donates refurbished bikes to children
Phoenix
- ASU Bike Co-op Downtown Campus https://fitness.asu.edu/services/bike-co-op
For ASU students during school year
Repair space with tools
Bicycle repair and maintenance instruction
Some free maintenance services
- Free Bikes for Kids https://fb4kphoenix.org/
Donates refurbished bikes to children
- Recycle your Bicycle https://www.recycleyourbicycleaz.com,
Donates refurbished bikes to children in foster care
- St Vincent De Paul https://www.stvincentdepaul.net/news/cycling-bikes-donation-provides-second-chance
Donates refurbished bikes to adults and children in need
- The Rusty Spoke Community Bicycle Collective Phoenix https://www.rustyspoke.org/
Repair space with tools
Parts recycling
Bicycle education and outreach
Community event space
Mesa
- ASU Bike Co-op Polytechnic Campus https://fitness.asu.edu/services/bike-co-op
For ASU students during school year
Repair space with tools
Bicycle repair and maintenance instruction
Some free maintenance services
Free rental bikes at Polytechnic campus
- City of Mesa Abandoned Bicycle Program https://www.mesaaz.gov/things-to-do/volunteer/abandoned-bicycle-program
Groups can request up to 30 bicycles to refurbish and distribute to people in need
- WeCycle https://wecycleusa.com/
Donates refurbished bikes to adults and children in need
Repair space with tools
Sierra Vista
- Sierra Vista Public Library Borrow-a-Bike https://www.sierravistaaz.gov/our-city/departments/library/borrow-a-bike
Library patrons may borrow a bicycle
Tempe
- ASU Bike Co-op Tempe Campus https://fitness.asu.edu/services/bike-co-op
For ASU students during school year
Repair space with tools
Bicycle repair and maintenance instruction
Some free maintenance services
- Bike Saviours Tempe https://www.bikesaviours.org/
Repair space with tools
Build a bike program
Work trade program
Repair classes
- Welcome to America https://www.wtap.org/
Provides refurbished bicycles for refugees
Tucson
- BICAS (bicycle inter community art & salvage) http://bicas.org
Repair space with tools
Earn a bike program (adults and kids)
Refurbished bikes for sale
- Wheels for Kids https://www.azwfk.org/
Donates refurbished bikes to children in need
Yuma
- Crossroads Rescue Mission https://crossroadsmission.org/
Bike Shop
Bike repair and service
All these groups are looking for help in some way. You can volunteer your time, donate your unneeded bicycles and parts, or help in other ways. And if you know of an adult or a child that needs a bicycle and is not able to get one, see if one of these groups may be able to help.
Bike Lanes Make Roads Safer for All Road Users
Bike lanes reduce crashes and fatalities for all road users and make the roadway more comfortable for both motor vehicle drivers and people riding bicycles. According to Barbara McCann, the director of Safety, Energy & Environment at the U.S. Department of Transportation (USDOT), bicycle lanes “reduces the frequency of crashes. It calms traffic, which makes streets less chaotic and safer for everyone.”
The addition of bicycle lanes on streets has been shown to
-
-
-
- Reduces frequency of crashes
- Calm traffic
- Encourage bicycle riders to stay off the sidewalk
- Create a barrier between motor traffic and pedestrians
- Make it clear to all road users which parts of the street are to be used by different users
- Increase bike ridership
- Reduce congestion for motorists
-
-
Ken McLeod of the League of American Bicyclists points out that
bike lanes of any kind calm traffic by reducing the width of the road, which signals to motorists that they should drive more carefully. Bike lanes also reduce the distance pedestrians are in contact with motor vehicles while crossing the street.
When protected bike lanes were installed on major streets fatalities fell by
38% in Chicago
40% in Denver
50% in San Francisco
60% in Seattle
75% in Portland, OR
A study in New York City found “when either conventional or protected bike lanes are added to NYC streets, risk of crashes and injuries decline by one-third and cyclist volumes increase by 50%.”
A study in San Francisco found that both motor vehicle drivers and bicyclists prefer separated bike lanes.
And a study in Chicago found that on roadways with bicycle rider specific traffic signals, cyclists are more likely to obey the red light than on streets without.
When advocating for better bicycle infrastructure you can use this information and point out that bike lanes are an USDOT Proven Safety Countermeasure. Keep in mind what Dan Burden, the founder of the Walkable and Livable Community Institute, says:
“The reason for bikeways is not just what they do for bicyclists, but what they do for the whole community.”
References:
- https://www.sciencedaily.com/releases/2019/05/190529113036.htm
- https://www.sciencedirect.com/science/article/abs/pii/S0965856416305018
- https://www.aarp.org/livable-communities/getting-around/info-2016/why-bicycling-infrastructure-is-good-for-people-who-dont-ride-bikes.html
- https://www.strongtowns.org/journal/2018/8/14/why-drivers-should-support-bike-lanes
- https://www.pasadenacsc.org/blog/protected-bike-lanes-increase-traffic-safety-for-everyone
- https://www.nyc.gov/html/dot/html/pr2021/biketober-bike-lanes-curcial-network-safety.shtml
- https://www.chicagotribune.com/autos/ct-xpm-2013-06-10-ct-met-getting-around-0610-20130610-story.html
- https://highways.dot.gov/safety/proven-safety-countermeasures/bicycle-lanes
- https://highways.dot.gov/sites/fhwa.dot.gov/files/2022-08/PSC_New_Bicycle%20Lanes.pdf
People Who Ride Bicycles Have a Positive Impact on Local Economy
There are many studies that show people who ride bicycles in urban areas shop more often and spend more money with local businesses than people who drive cars. This means that in addition to supporting local businesses, bike riders are likely paying more money in local taxes that vehicle drivers.
When advocating for bicycle infrastructure, remember that government representatives, community leaders, and business owners typically underestimate the number of people who bike and how much money they spend. To help with these conversations, the Coalition of Arizona Bicyclists is providing these references to bicycle economic impact studies.
- In Pima County’s report on the Loop, they estimated that for every $1 spent on the multiuse path the county received $9.40 in economic benefits. https://www.americancityandcounty.com/2021/11/15/trails-greenways-and-parks-infrastructure-projects-boost-economic-activity-and-help-residents-live-healthier-lives/
- After a road diet on a street in Fort Worth, Texas restaurants showed a 179% revenue increase. Blue, Bikenomics, How Bicycles Can Save The Economy, Microcosm Publishing, 2016
- In an area of Los Angeles, California where motor vehicle lanes were removed and replaced with bicycle lanes, the sales taxes collected almost doubled.https://nacto.org/docs/usdg/yorkblvd_mccormick.pdf
- A study from researchers at New York University (NYU) shows that restaurants closer to bike share stations do better business than those farther away. They found that food retailers (typically restaurants) in the Brooklyn neighborhoods closest to bike share stations saw their total volume of business increase from between .2 and .5 percent in the years after bike share stations were added. Food retailers in the same neighborhoods located farther from bike share stations saw level or slight decreases in retail volume. https://arxiv.org/ftp/arxiv/papers/1712/1712.00659.pdf
- Another study in New York, New York found that sales increased 12 percent after a bike lane was added. https://nyc.streetsblog.org/2022/09/30/business-grew-on-queens-street-after-controversial-bike-lane-installed-data-show/
- A third study in New York City found that businesses on streets that remained closed to motor vehicle traffic after the COVID 19 pandemic showed sales increases of 19% over pre-pandemic levels, while businesses on streets that remained open to motor traffic during the pandemic showed reduced sales. https://www.route-fifty.com/infrastructure/2022/10/what-closing-streets-cars-meant-restaurant-sales-new-york-city/378902/
- A study of 12 Portland, Oregon area active transportation projects showed overall positive impact on local economy. 75% of the projects showed measurable economic improvement for both food and retail businesses. The projects that did not show economic improvement were areas with higher motor vehicle volumes and/or higher motor vehicle speeds. https://trec.pdx.edu/news/active-transportation-projects-offer-solid-returns-investment-economic-study-finds https://www.oregonmetro.gov/sites/default/files/2022/05/15/Active-Transportation-Return-on-Investment-study-2022.pdf
- A study in San Francisco, California found that bike lanes “rarely produce profoundly negative outcomes, and that they are often associated with positive business performance outcomes” and that “different types of businesses experience bicycle lane interventions differently, [so] transportation planners need to understand and carefully account for the mix of businesses in implementation sites.” https://journals.sagepub.com/doi/10.1177/0361198118792321
- A study conducted in Toronto, Ontario, Canada found that in an area where street parking was replaced with a bike lane there was an increase in both the number of customers at retail businesses and the amount spent.https://www.tcat.ca/business-is-up-on-bloor-after-bike-lane-new-study-finds/ https://www.tandfonline.com/eprint/XAKZKXBAV87MIAK4TACP/full?target=10.1080/01944363.2019.1638816
Is Your Community Following National Guidelines When Installing Bicycle Lanes?
The U.S. Department of Transportation Federal Highway Administration (FHWA) and the National Association of City Transportation Officials (NACTO) both provide guidelines for communities to use when determining the appropriate type of bike lane on streets and roadways. Both agencies recommend that separated or protected bike lanes be used for roads at much lower speeds than are seen in most Arizona communities. Continue reading Is Your Community Following National Guidelines When Installing Bicycle Lanes?
People Who Ride Bicycles on the Roadway Already Pay Their Share
When there is conversation about building bicycle facilities, we often hear rumblings that people who ride bicycles don’t pay their fair share of the expense of transportation infrastructure. This statement is not true. Bicycle riders often pay more than their share for the amount of bicycle infrastructure created, and for the amount of roadway they actually use. Bicycle riders also provide more financial contributions to the local economy then drivers of cars.
Most bicycle facilities in the United States are built at the local level, with little or no funding coming from the federal taxes on gasoline and truck tires that support the Federal Highway Trust Fund (HTF). In 2017, 74% of the $177B spent on road and highway infrastructure in the United States came from state and local government.[i] As a result, the argument that all or most roadway money comes from the HTF and should not be used for bicycle infrastructure is not supported. The money used locally usually comes from general tax payer dollars, and people who don’t drive cars pay those taxes. Another source of local transportation money comes from property tax, which homeowners pay directly and renters pay through their rent.[ii]
Overall, in the U.S., close to 50% of roadway construction and maintenance is paid for by income tax and other non-gas tax revenue sources. [iii] [iv]
Cost to Support Roadways
Based on estimates from 2015, the average U.S. household could be paying more than $1100 per year in taxes and other costs to support roadways. This includes households that don’t own cars or use alternative sources of mobility. [v]
- $597 in general taxes for road construction and repair
- $199 to $675 for subsidies to motor vehicle drivers (parking, gas tax exemptions, etc.)
- $216 in government expenses related to traffic crashes
- $93 to $360 for costs related to air pollution
Many of the costs related to motor vehicles (air pollution, noise pollution, crash damage to non-drivers and property, etc.) are paid for by crash victims, taxpayers and the government (which gets most of its money from taxpayers).[vi] Jeff Speck, the author of the book the Walkable City, estimates that in the U.S. vehicle drivers are subsidized $10 for every $1 they actual pay for infrastructure.[vii]
Households without Cars
The U.S. Census Bureau estimates that about 9% of households do not have regular access to a motor vehicle for transportation.[viii] In the greater Phoenix area that is estimated to be about 6%.[ix] Some research shows the number of U.S. households without motor vehicles has increased slightly from 2010.[x] The 2016 American Community Survey showed both a decrease in single vehicle drivers commuting and an increase in people on bicycles commuting.[xi]
Local Transportation Funding
Determining how transportation is funded at the local level is not always the easiest. For this article a number of Arizona communities provided information on how to access their transportation budget on line. None of the sites had clear “dollars in to dollars out” comparisons. As an example, the City of Mesa 2020 budget for transportation shows spending of $39.53M. Based on conversations with city staff, that money comes from the State Highway Users Revenue Fund (HURF) and a funding source called The Local Street Fund. Money from these sources covers Mesa’s street repair and maintenance. Street Bonds and the Transportation Fund support specific transportation projects, with a projected 2022 spending of $211M. Using the budgets posted online there did not appear to be clear way to determine what spending went to bicycle infrastructure.[xii]
Regional Transportation Funding
Maricopa and Pima Counties currently have one half cent sales taxes that support their regional transportation plans. Again this is paid by all shoppers regardless of motor vehicle ownership or miles driven. In Maricopa County only 10.5 percent of the money collected through that tax goes to arterial street improvements; 56.2 percent goes to freeways and state highways, and 33.3 percent going to public transit. [xiii]
State Transportation Funding
In Arizona, fuel and motor vehicle license taxes support 80% of the Highway Users Revenue Fund (HURF), [xiv] but 62% of state transportation spending coming from state and local taxes.[xv] ADOT states that HURF is constrained by use of more fuel efficient vehicles, inflation, and the lack of an increase in the state gas tax for over 25 years.[xvi]
Federal Transportation Funding
Taking the federal gas tax, the heavy truck tire tax, and other motor vehicle user fees into consideration, the amount of money collected has never covered the cost of operating the part of the roadway system they are supposed to support.[xvii] Between 2008 and 2018, 114.7 billion dollars were transferred from the General Fund of the Treasury to the Federal Highway Trust Fund (HTF).[xviii] Moneys in the Federal Treasury’s General Fund are primarily tax dollars collected from people and businesses. [ii]
As a result of inflation, improved motor vehicle fuel economy, reduced motor vehicle miles driven, and the increase in electric vehicles, moneys collected for the HTF are not expected to increase. [ii] Congressional Budget Office estimates, made in 2020, are that the HTF will hit a zero balance starting in 2022, and that zero balance will continue for all future years unless there is a change to the gas tax.[xix] [xx] It is estimated that highway spending would need to increase by 40% over the next 10 years to fund all existing highway construction and maintenance projects. [xxi] The deficit in the HFT is expected to reach $200B by 2030.[xxii]
Motor Vehicle Driver Subsidies
Drivers of motor vehicles can receive federally tax supported subsidies that are not available riders of bicycles. Employers can receive a subsidy for electric vehicle charging stations, but not for chargers for e-bikes. People can put part of their salary in a tax free fund for workplace car parking or public transit, but there isn’t tax free fund that supports bicycle riding. There is currently a tax credit for purchase of an electric car, but no tax credit for the purchase of an electric or non-electric bicycle. [xxiii]
Bicycle Rider Impact on Roadways
At the local level, bicycle riders have a more positive financial impact compared to motor vehicles when considering pollution, roadway maintenance, health, and other measures. Bicycle infrastructure uses fewer resources to build and maintain. Bicycle riders have less impact on the roadway, use a fraction of the space used by motor vehicles, and cause less crashes. A review of 10 studies showed that the financial benefit of active transportation programs was greater than the cost of those programs. [xxiv]
Bicycle Rider Impact on Local Economy
Bicycle riders also do more to improve the local economy. A number of studies show that people who ride bicycles in urban centers spend more money and shop more often with local businesses than people who drive cars.[xxv] [xxvi] [xxvii] This likely means that bicycle riders are paying more money in local taxes than vehicle drivers. In an area of Los Angeles where motor vehicle lanes were removed and replaced with bicycle lanes, the sales taxes collected almost doubled.[xxviii]
Conclusion
As people who ride bicycles, we are clearly supporting our share of the traffic infrastructure we use to ride, along with supporting infrastructure for motor vehicles. Keep this in mind when advocating for new bicycle facilities and the maintenance of existing infrastructure.
—–
[i] _____, The Highway Trust Fund Explained, Peter P. Peterson Foundation, 2020, https://www.pgpf.org/budget-basics/budget-explainer-highway-trust-fund
[ii] Blue, Bikenomics, How Bicycles Can Save The Economy, Microcosm Publishing, 2016
[iii] Cammenga, How Are Your State’s Roads Funded?, Tax Foundation, 2019, https://taxfoundation.org/states-road-funding-2019/
[iv] Dutzik, et al., Who Pays for the Roads? How the “Users Pay” Myth Gets in the Way, United States Public Interest Research Group (U.S. PIRG), 2015, https://uspirg.org/sites/pirg/files/reports/Who%20Pays%20for%20Roads%20vUS.pdf
[v] Ibid.
[vi] Ibid.
[vii] Birenbaum, How to End the American Obsession With Driving, Vox, 2021, https://www.vox.com/22662963/end-driving-obsession-connectivity-zoning-parking
[viii] _____, American Community Survey, Why We Ask About Vehicles Available, U.S. Census Bureau, ____, https://www.census.gov/acs/www/about/why-we-ask-each-question/vehicles/
[ix] Peterson, Car Owner Statistics (2021 Report), ValuePenguin, 2021, https://www.valuepenguin.com/auto-insurance/car-ownership-statistics
[x] Gershgorn, After decades of decline, no-car households are becoming more common in the US, Quartz, 2016, https://qz.com/873704/no-car-households-are-becoming-more-common-in-the-us-after-decades-of-decline/
[xi] Tomer, America’s commuting choices: 5 major takeaways from 2016 census data, Brookings, 2017, https://www.brookings.edu/blog/the-avenue/2017/10/03/americans-commuting-choices-5-major-takeaways-from-2016-census-data/
[xii] _____, City of Mesa’s Open Budget, City of Mesa, AZ, 2021, https://openbudget.mesaaz.gov/#!/year/default
[xiii] _____, 2022-2026 Current Five-Year Transportation Facilities Construction Program, Arizona Department of Transportation, 2021, https://apps.azdot.gov/ADOTLibrary/Multimodal_Planning_Division/FiveYrPlan/Five_Year_Program-FY2022-26.pdf
[xiv] Boesen, Who Will Pay for the Roads?, Tax Foundation, 2022, https://taxfoundation.org/road-funding-vehicle-miles-traveled-tax/
[xv] _____, 2022-2026 Current Five-Year Transportation Facilities Construction Program.
[xvi] Ibid.
[xvii] Dutzik, et al., Who Pays for the Roads? How the “Users Pay” Myth Gets in the Way.
[xviii]_____, The Highway Trust Fund Publication No. FHWA-PL-17-011, U.S. Department of Transportation, Federal Highway Administration, Office of Policy and Government Affairs, 2017 https://www.fhwa.dot.gov/policy/olsp/fundingfederalaid/07.cfm
[xix] York, How Did We Ever Agree to Infrastructure Investments, Tax Foundation, 2021, https://taxfoundation.org/infrastructure-investment/
[xx]_____, Highway Trust Fund Accounts—CBO’s Baseline as of March 6, 2020, Congressional Budget Office, 2020, https://www.cbo.gov/system/files/2020-03/51300-2020-03-highwaytrustfund.pdf
[xxi] _____, The Highway Trust Fund Explained.
[xxii]_____, Supplemental Data for The Budget and Economic Outlook: 2021 to 2031, Congressional Budget Office, 2021, https://www.cbo.gov/system/files/2021-02/51300-2021-02-highwaytrustfund.pdf
[xxiii] Zipper, What if Congress Helped Bicyclists, and Not Drivers, for Once?, Slate, 2021, https://slate.com/business/2021/09/bicycles-reconciliaton-congress-ebikes.html
[xxiv] Dutzik, et al., Who Pays for the Roads? How the “Users Pay” Myth Gets in the Way.
[xxv] _____, Measuring the Street: New Metrics for 21st Century Streets, New York City DOT, _____, http://www.nyc.gov/html/dot/downloads/pdf/2012-10-measuring-the-street.pdf
[xxvi] Ayre, Salt Lake City Street’s Decision To Replace Parking With Bike Lanes Boosted Business, bikocity, 2016, https://bikocity.com/salt-lake-city-streets-decision-replace-parking-bike-lanes-boosted-business/
[xxvii] Clifton, et al. , Consumer Behavior and Travel Choices: A Focus on Cyclists and Pedestrians, Portland State University Department of Civil and Environmental Engineering, 2012, https://nacto.org/docs/usdg/consumer_behavior_and_travel_choices_clifton.pdf
[xxviii] McCormick, York Blvd, The Economics of a Road Diet , UCLA Luskin School of Public Affairs, _____, https://nacto.org/docs/usdg/yorkblvd_mccormick.pdf