
Below is a summary of the CAZBIKE Strategic Plan. It also includes results of the statewide survey gathered in early 2025; with 130 responses representing 35+ cities and towns across the state. Continue reading Strategic Plan Summary
Category: advocacy

Arizona Bicycle Organizations – Volunteer and Riding Opportunities
Are you looking for bicycle advocacy or volunteer opportunities in your community or at the state or regional level?
Or are you looking for more opportunities to ride your bicycle?
The Coalition of Arizona Bicyclists has compiled a list of advocacy groups, community organizations, and bicycle clubs. Continue reading Arizona Bicycle Organizations – Volunteer and Riding Opportunities

Here’s a List of Organizaations that Have Bicycles for People Who Need Them
While the Coalition of Arizona Bicycles doesn’t provide bicycles, there are groups throughout Arizona that refurbish bicycles and provide them to people who need bikes. These groups provide bicycles for adults and children. Some of these groups provide shop space for doing repairs, earn-a-bike programs, repair and maintenance instruction, and more. These groups have opportunities for volunteers and are often looking for donations of bicycles, parts, tools and/or cash.
Coconino County https://www.facebook.com/photo/?fbid=730728779081216&set=a.304668665020565
- Coconino County Health and Human Services
Bicycles for people that need them for transportation
Flagstaff
- Lefty Loosey Bike Co-op https://www.leftylooseybikes.org/about
Donates refurbished bikes to people in need
Repair space with tools
Bicycle repair and maintenance instruction
Fountain Hills
- Bob’s Free Bikes https://www.bobsfreebikes.org/
Donates refurbished bikes to children
Phoenix
- ASU Bike Co-op Downtown Campus https://fitness.asu.edu/services/bike-co-op
For ASU students during school year
Repair space with tools
Bicycle repair and maintenance instruction
Some free maintenance services
- Free Bikes for Kids https://fb4kphoenix.org/
Donates refurbished bikes to children
- Recycle your Bicycle https://www.recycleyourbicycleaz.com,
Donates refurbished bikes to children in foster care
- St Vincent De Paul https://www.stvincentdepaul.net/news/cycling-bikes-donation-provides-second-chance
Donates refurbished bikes to adults and children in need
- The Rusty Spoke Community Bicycle Collective Phoenix https://www.rustyspoke.org/
Repair space with tools
Parts recycling
Bicycle education and outreach
Community event space
Mesa
- ASU Bike Co-op Polytechnic Campus https://fitness.asu.edu/services/bike-co-op
For ASU students during school year
Repair space with tools
Bicycle repair and maintenance instruction
Some free maintenance services
Free rental bikes at Polytechnic campus
- City of Mesa Abandoned Bicycle Program https://www.mesaaz.gov/things-to-do/volunteer/abandoned-bicycle-program
Groups can request up to 30 bicycles to refurbish and distribute to people in need
- WeCycle https://wecycleusa.com/
Donates refurbished bikes to adults and children in need
Repair space with tools
Sierra Vista
- Sierra Vista Public Library Borrow-a-Bike https://www.sierravistaaz.gov/our-city/departments/library/borrow-a-bike
Library patrons may borrow a bicycle
Tempe
- ASU Bike Co-op Tempe Campus https://fitness.asu.edu/services/bike-co-op
For ASU students during school year
Repair space with tools
Bicycle repair and maintenance instruction
Some free maintenance services
- Bike Saviours Tempe https://www.bikesaviours.org/
Repair space with tools
Build a bike program
Work trade program
Repair classes
- Welcome to America https://www.wtap.org/
Provides refurbished bicycles for refugees
Tucson
- BICAS (bicycle inter community art & salvage) http://bicas.org
Repair space with tools
Earn a bike program (adults and kids)
Refurbished bikes for sale
- Wheels for Kids https://www.azwfk.org/
Donates refurbished bikes to children in need
Yuma
- Crossroads Rescue Mission https://crossroadsmission.org/
Bike Shop
Bike repair and service
All these groups are looking for help in some way. You can volunteer your time, donate your unneeded bicycles and parts, or help in other ways. And if you know of an adult or a child that needs a bicycle and is not able to get one, see if one of these groups may be able to help.
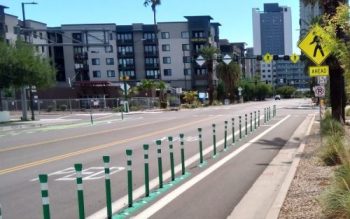
Bike Lanes Make Roads Safer for All Road Users
Bike lanes reduce crashes and fatalities for all road users and make the roadway more comfortable for both motor vehicle drivers and people riding bicycles. According to Barbara McCann, the director of Safety, Energy & Environment at the U.S. Department of Transportation (USDOT), bicycle lanes “reduces the frequency of crashes. It calms traffic, which makes streets less chaotic and safer for everyone.”
The addition of bicycle lanes on streets has been shown to
-
-
-
- Reduces frequency of crashes
- Calm traffic
- Encourage bicycle riders to stay off the sidewalk
- Create a barrier between motor traffic and pedestrians
- Make it clear to all road users which parts of the street are to be used by different users
- Increase bike ridership
- Reduce congestion for motorists
-
-
Ken McLeod of the League of American Bicyclists points out that
bike lanes of any kind calm traffic by reducing the width of the road, which signals to motorists that they should drive more carefully. Bike lanes also reduce the distance pedestrians are in contact with motor vehicles while crossing the street.
When protected bike lanes were installed on major streets fatalities fell by
38% in Chicago
40% in Denver
50% in San Francisco
60% in Seattle
75% in Portland, OR
A study in New York City found “when either conventional or protected bike lanes are added to NYC streets, risk of crashes and injuries decline by one-third and cyclist volumes increase by 50%.”
A study in San Francisco found that both motor vehicle drivers and bicyclists prefer separated bike lanes.
And a study in Chicago found that on roadways with bicycle rider specific traffic signals, cyclists are more likely to obey the red light than on streets without.
When advocating for better bicycle infrastructure you can use this information and point out that bike lanes are an USDOT Proven Safety Countermeasure. Keep in mind what Dan Burden, the founder of the Walkable and Livable Community Institute, says:
“The reason for bikeways is not just what they do for bicyclists, but what they do for the whole community.”
References:
- https://www.sciencedaily.com/releases/2019/05/190529113036.htm
- https://www.sciencedirect.com/science/article/abs/pii/S0965856416305018
- https://www.aarp.org/livable-communities/getting-around/info-2016/why-bicycling-infrastructure-is-good-for-people-who-dont-ride-bikes.html
- https://www.strongtowns.org/journal/2018/8/14/why-drivers-should-support-bike-lanes
- https://www.pasadenacsc.org/blog/protected-bike-lanes-increase-traffic-safety-for-everyone
- https://www.nyc.gov/html/dot/html/pr2021/biketober-bike-lanes-curcial-network-safety.shtml
- https://www.chicagotribune.com/autos/ct-xpm-2013-06-10-ct-met-getting-around-0610-20130610-story.html
- https://highways.dot.gov/safety/proven-safety-countermeasures/bicycle-lanes
- https://highways.dot.gov/sites/fhwa.dot.gov/files/2022-08/PSC_New_Bicycle%20Lanes.pdf

People Who Ride Bicycles Have a Positive Impact on Local Economy
There are many studies that show people who ride bicycles in urban areas shop more often and spend more money with local businesses than people who drive cars. This means that in addition to supporting local businesses, bike riders are likely paying more money in local taxes that vehicle drivers.
When advocating for bicycle infrastructure, remember that government representatives, community leaders, and business owners typically underestimate the number of people who bike and how much money they spend. To help with these conversations, the Coalition of Arizona Bicyclists is providing these references to bicycle economic impact studies.
- In Pima County’s report on the Loop, they estimated that for every $1 spent on the multiuse path the county received $9.40 in economic benefits. https://www.americancityandcounty.com/2021/11/15/trails-greenways-and-parks-infrastructure-projects-boost-economic-activity-and-help-residents-live-healthier-lives/
- After a road diet on a street in Fort Worth, Texas restaurants showed a 179% revenue increase. Blue, Bikenomics, How Bicycles Can Save The Economy, Microcosm Publishing, 2016
- In an area of Los Angeles, California where motor vehicle lanes were removed and replaced with bicycle lanes, the sales taxes collected almost doubled.https://nacto.org/docs/usdg/yorkblvd_mccormick.pdf
- A study from researchers at New York University (NYU) shows that restaurants closer to bike share stations do better business than those farther away. They found that food retailers (typically restaurants) in the Brooklyn neighborhoods closest to bike share stations saw their total volume of business increase from between .2 and .5 percent in the years after bike share stations were added. Food retailers in the same neighborhoods located farther from bike share stations saw level or slight decreases in retail volume. https://arxiv.org/ftp/arxiv/papers/1712/1712.00659.pdf
- Another study in New York, New York found that sales increased 12 percent after a bike lane was added. https://nyc.streetsblog.org/2022/09/30/business-grew-on-queens-street-after-controversial-bike-lane-installed-data-show/
- A third study in New York City found that businesses on streets that remained closed to motor vehicle traffic after the COVID 19 pandemic showed sales increases of 19% over pre-pandemic levels, while businesses on streets that remained open to motor traffic during the pandemic showed reduced sales. https://www.route-fifty.com/infrastructure/2022/10/what-closing-streets-cars-meant-restaurant-sales-new-york-city/378902/
- A study of 12 Portland, Oregon area active transportation projects showed overall positive impact on local economy. 75% of the projects showed measurable economic improvement for both food and retail businesses. The projects that did not show economic improvement were areas with higher motor vehicle volumes and/or higher motor vehicle speeds. https://trec.pdx.edu/news/active-transportation-projects-offer-solid-returns-investment-economic-study-finds https://www.oregonmetro.gov/sites/default/files/2022/05/15/Active-Transportation-Return-on-Investment-study-2022.pdf
- A study in San Francisco, California found that bike lanes “rarely produce profoundly negative outcomes, and that they are often associated with positive business performance outcomes” and that “different types of businesses experience bicycle lane interventions differently, [so] transportation planners need to understand and carefully account for the mix of businesses in implementation sites.” https://journals.sagepub.com/doi/10.1177/0361198118792321
- A study conducted in Toronto, Ontario, Canada found that in an area where street parking was replaced with a bike lane there was an increase in both the number of customers at retail businesses and the amount spent.https://www.tcat.ca/business-is-up-on-bloor-after-bike-lane-new-study-finds/ https://www.tandfonline.com/eprint/XAKZKXBAV87MIAK4TACP/full?target=10.1080/01944363.2019.1638816
Arizona Alliance for Livable Communities
![]() Coalition Board member Bernie Hoenle will be participating in the AALC, and reporting on items of interest to Arizona bicyclists.
Coalition Board member Bernie Hoenle will be participating in the AALC, and reporting on items of interest to Arizona bicyclists.
Notes from Arizona Alliance for Livable Communities livableaz.org meeting 9/14/2022
1. Referenced National Recreation and Parks Association international convention being held in Phoenix 9/20-23/2022. Wide range of topics from health related to planning, security, equity… and does have a session on ebikes and other surface transportation.
2. Advocacy letter which CAZBike added their support.
Bipartisan bill supporting safe streets and the Vision Zero program, here’s a copy of the letter.
3. Prop 400 which would keep tax funds supporting AZ roads was vetoed by the Governor. Plans to resurrect are underway, but challenging timing. (Maricopa county is the only AZ County that needs to get state approval.)
4. Road Safety Action Plan incorporates Vision Zero. AZ record for large number of pedestrian fatalities. There is $10M dedicated funding. Working to align projects with focus on overall safety. Some contention based on POV. Concerted effort
to improve underserved communities.
5. Phoenix hired first Public Health Advisor, Nicole Dupuis-Witt. Starts 10/17/2022. To address city top priorities: heat response/mitigation, housing, homelessness, food systems, senior services, transportation, and more…
6. Some discussion on General Obligation Bonds. How they can be used to support multiple aspects of streets, pedestrians, cycling – tie to Capital Improvement Projects.
7. Planning and health: members reviewing municipal plans. Planning guidance and references on: liveableaz.org/general-plans/ Making connections and communications with all parties important for success.
8. Bisbee – active group advocating better biking and walking in the area.
References:
nrpa.org
apbp.org
azaep.org
phoenix.gov
bisbeebikeways.com
Is Your Community Following National Guidelines When Installing Bicycle Lanes?
The U.S. Department of Transportation Federal Highway Administration (FHWA) and the National Association of City Transportation Officials (NACTO) both provide guidelines for communities to use when determining the appropriate type of bike lane on streets and roadways. Both agencies recommend that separated or protected bike lanes be used for roads at much lower speeds than are seen in most Arizona communities. Continue reading Is Your Community Following National Guidelines When Installing Bicycle Lanes?
People Who Ride Bicycles on the Roadway Already Pay Their Share
People Who Ride Bicycles on the Roadway Already Pay Their Share

When there is conversation about building bicycle facilities, we often hear rumblings that people who ride bicycles don’t pay their fair share of the expense of transportation infrastructure. This statement is not true. Bicycle riders often pay more than their share for the amount of bicycle infrastructure created, and for the amount of roadway they actually use. Bicycle riders also provide more financial contributions to the local economy then drivers of cars.
Most bicycle facilities in the United States are built at the local level, with little or no funding coming from the federal taxes on gasoline and truck tires that support the Federal Highway Trust Fund (HTF). In 2017, 74% of the $177B spent on road and highway infrastructure in the United States came from state and local government.[i] As a result, the argument that all or most roadway money comes from the HTF and should not be used for bicycle infrastructure is not supported. The money used locally usually comes from general tax payer dollars, and people who don’t drive cars pay those taxes. Another source of local transportation money comes from property tax, which homeowners pay directly and renters pay through their rent.[ii]
Overall, in the U.S., close to 50% of roadway construction and maintenance is paid for by income tax and other non-gas tax revenue sources. [iii] [iv]
Cost to Support Roadways
Based on estimates from 2015, the average U.S. household could be paying more than $1100 per year in taxes and other costs to support roadways. This includes households that don’t own cars or use alternative sources of mobility. [v]
- $597 in general taxes for road construction and repair
- $199 to $675 for subsidies to motor vehicle drivers (parking, gas tax exemptions, etc.)
- $216 in government expenses related to traffic crashes
- $93 to $360 for costs related to air pollution
Many of the costs related to motor vehicles (air pollution, noise pollution, crash damage to non-drivers and property, etc.) are paid for by crash victims, taxpayers and the government (which gets most of its money from taxpayers).[vi] Jeff Speck, the author of the book the Walkable City, estimates that in the U.S. vehicle drivers are subsidized $10 for every $1 they actual pay for infrastructure.[vii]
Households without Cars
The U.S. Census Bureau estimates that about 9% of households do not have regular access to a motor vehicle for transportation.[viii] In the greater Phoenix area that is estimated to be about 6%.[ix] Some research shows the number of U.S. households without motor vehicles has increased slightly from 2010.[x] The 2016 American Community Survey showed both a decrease in single vehicle drivers commuting and an increase in people on bicycles commuting.[xi]
Local Transportation Funding
Determining how transportation is funded at the local level is not always the easiest. For this article a number of Arizona communities provided information on how to access their transportation budget on line. None of the sites had clear “dollars in to dollars out” comparisons. As an example, the City of Mesa 2020 budget for transportation shows spending of $39.53M. Based on conversations with city staff, that money comes from the State Highway Users Revenue Fund (HURF) and a funding source called The Local Street Fund. Money from these sources covers Mesa’s street repair and maintenance. Street Bonds and the Transportation Fund support specific transportation projects, with a projected 2022 spending of $211M. Using the budgets posted online there did not appear to be clear way to determine what spending went to bicycle infrastructure.[xii]
Regional Transportation Funding
Maricopa and Pima Counties currently have one half cent sales taxes that support their regional transportation plans. Again this is paid by all shoppers regardless of motor vehicle ownership or miles driven. In Maricopa County only 10.5 percent of the money collected through that tax goes to arterial street improvements; 56.2 percent goes to freeways and state highways, and 33.3 percent going to public transit. [xiii]
State Transportation Funding
In Arizona, fuel and motor vehicle license taxes support 80% of the Highway Users Revenue Fund (HURF), [xiv] but 62% of state transportation spending coming from state and local taxes.[xv] ADOT states that HURF is constrained by use of more fuel efficient vehicles, inflation, and the lack of an increase in the state gas tax for over 25 years.[xvi]
Federal Transportation Funding
Taking the federal gas tax, the heavy truck tire tax, and other motor vehicle user fees into consideration, the amount of money collected has never covered the cost of operating the part of the roadway system they are supposed to support.[xvii] Between 2008 and 2018, 114.7 billion dollars were transferred from the General Fund of the Treasury to the Federal Highway Trust Fund (HTF).[xviii] Moneys in the Federal Treasury’s General Fund are primarily tax dollars collected from people and businesses. [ii]
As a result of inflation, improved motor vehicle fuel economy, reduced motor vehicle miles driven, and the increase in electric vehicles, moneys collected for the HTF are not expected to increase. [ii] Congressional Budget Office estimates, made in 2020, are that the HTF will hit a zero balance starting in 2022, and that zero balance will continue for all future years unless there is a change to the gas tax.[xix] [xx] It is estimated that highway spending would need to increase by 40% over the next 10 years to fund all existing highway construction and maintenance projects. [xxi] The deficit in the HFT is expected to reach $200B by 2030.[xxii]
Motor Vehicle Driver Subsidies
Drivers of motor vehicles can receive federally tax supported subsidies that are not available riders of bicycles. Employers can receive a subsidy for electric vehicle charging stations, but not for chargers for e-bikes. People can put part of their salary in a tax free fund for workplace car parking or public transit, but there isn’t tax free fund that supports bicycle riding. There is currently a tax credit for purchase of an electric car, but no tax credit for the purchase of an electric or non-electric bicycle. [xxiii]
Bicycle Rider Impact on Roadways
At the local level, bicycle riders have a more positive financial impact compared to motor vehicles when considering pollution, roadway maintenance, health, and other measures. Bicycle infrastructure uses fewer resources to build and maintain. Bicycle riders have less impact on the roadway, use a fraction of the space used by motor vehicles, and cause less crashes. A review of 10 studies showed that the financial benefit of active transportation programs was greater than the cost of those programs. [xxiv]
Bicycle Rider Impact on Local Economy
Bicycle riders also do more to improve the local economy. A number of studies show that people who ride bicycles in urban centers spend more money and shop more often with local businesses than people who drive cars.[xxv] [xxvi] [xxvii] This likely means that bicycle riders are paying more money in local taxes than vehicle drivers. In an area of Los Angeles where motor vehicle lanes were removed and replaced with bicycle lanes, the sales taxes collected almost doubled.[xxviii]
Conclusion
As people who ride bicycles, we are clearly supporting our share of the traffic infrastructure we use to ride, along with supporting infrastructure for motor vehicles. Keep this in mind when advocating for new bicycle facilities and the maintenance of existing infrastructure.
—–
[i] _____, The Highway Trust Fund Explained, Peter P. Peterson Foundation, 2020, https://www.pgpf.org/budget-basics/budget-explainer-highway-trust-fund
[ii] Blue, Bikenomics, How Bicycles Can Save The Economy, Microcosm Publishing, 2016
[iii] Cammenga, How Are Your State’s Roads Funded?, Tax Foundation, 2019, https://taxfoundation.org/states-road-funding-2019/
[iv] Dutzik, et al., Who Pays for the Roads? How the “Users Pay” Myth Gets in the Way, United States Public Interest Research Group (U.S. PIRG), 2015, https://uspirg.org/sites/pirg/files/reports/Who%20Pays%20for%20Roads%20vUS.pdf
[v] Ibid.
[vi] Ibid.
[vii] Birenbaum, How to End the American Obsession With Driving, Vox, 2021, https://www.vox.com/22662963/end-driving-obsession-connectivity-zoning-parking
[viii] _____, American Community Survey, Why We Ask About Vehicles Available, U.S. Census Bureau, ____, https://www.census.gov/acs/www/about/why-we-ask-each-question/vehicles/
[ix] Peterson, Car Owner Statistics (2021 Report), ValuePenguin, 2021, https://www.valuepenguin.com/auto-insurance/car-ownership-statistics
[x] Gershgorn, After decades of decline, no-car households are becoming more common in the US, Quartz, 2016, https://qz.com/873704/no-car-households-are-becoming-more-common-in-the-us-after-decades-of-decline/
[xi] Tomer, America’s commuting choices: 5 major takeaways from 2016 census data, Brookings, 2017, https://www.brookings.edu/blog/the-avenue/2017/10/03/americans-commuting-choices-5-major-takeaways-from-2016-census-data/
[xii] _____, City of Mesa’s Open Budget, City of Mesa, AZ, 2021, https://openbudget.mesaaz.gov/#!/year/default
[xiii] _____, 2022-2026 Current Five-Year Transportation Facilities Construction Program, Arizona Department of Transportation, 2021, https://apps.azdot.gov/ADOTLibrary/Multimodal_Planning_Division/FiveYrPlan/Five_Year_Program-FY2022-26.pdf
[xiv] Boesen, Who Will Pay for the Roads?, Tax Foundation, 2022, https://taxfoundation.org/road-funding-vehicle-miles-traveled-tax/
[xv] _____, 2022-2026 Current Five-Year Transportation Facilities Construction Program.
[xvi] Ibid.
[xvii] Dutzik, et al., Who Pays for the Roads? How the “Users Pay” Myth Gets in the Way.
[xviii]_____, The Highway Trust Fund Publication No. FHWA-PL-17-011, U.S. Department of Transportation, Federal Highway Administration, Office of Policy and Government Affairs, 2017 https://www.fhwa.dot.gov/policy/olsp/fundingfederalaid/07.cfm
[xix] York, How Did We Ever Agree to Infrastructure Investments, Tax Foundation, 2021, https://taxfoundation.org/infrastructure-investment/
[xx]_____, Highway Trust Fund Accounts—CBO’s Baseline as of March 6, 2020, Congressional Budget Office, 2020, https://www.cbo.gov/system/files/2020-03/51300-2020-03-highwaytrustfund.pdf
[xxi] _____, The Highway Trust Fund Explained.
[xxii]_____, Supplemental Data for The Budget and Economic Outlook: 2021 to 2031, Congressional Budget Office, 2021, https://www.cbo.gov/system/files/2021-02/51300-2021-02-highwaytrustfund.pdf
[xxiii] Zipper, What if Congress Helped Bicyclists, and Not Drivers, for Once?, Slate, 2021, https://slate.com/business/2021/09/bicycles-reconciliaton-congress-ebikes.html
[xxiv] Dutzik, et al., Who Pays for the Roads? How the “Users Pay” Myth Gets in the Way.
[xxv] _____, Measuring the Street: New Metrics for 21st Century Streets, New York City DOT, _____, http://www.nyc.gov/html/dot/downloads/pdf/2012-10-measuring-the-street.pdf
[xxvi] Ayre, Salt Lake City Street’s Decision To Replace Parking With Bike Lanes Boosted Business, bikocity, 2016, https://bikocity.com/salt-lake-city-streets-decision-replace-parking-bike-lanes-boosted-business/
[xxvii] Clifton, et al. , Consumer Behavior and Travel Choices: A Focus on Cyclists and Pedestrians, Portland State University Department of Civil and Environmental Engineering, 2012, https://nacto.org/docs/usdg/consumer_behavior_and_travel_choices_clifton.pdf
[xxviii] McCormick, York Blvd, The Economics of a Road Diet , UCLA Luskin School of Public Affairs, _____, https://nacto.org/docs/usdg/yorkblvd_mccormick.pdf
You Can Help Improve Your Communities Bicycle Network
 A number of Arizona communities recently passed initiatives to expand transportation infrastructure including improving bicycle facilities. In addition, there is proposed federal legislation that would make additional moneys available for expanding active transportation networks. This poses the question, what can you as an individual do to improving bicycle facilities in your community?
The first recommendation is to review the city’s transportation plan and active transportation plan if there is one. Do these have specific goals in creating bicycle infrastructure? If so, that should be a guide in the development process. Also determine if your community has a bicycle coordinator or a specific person to contact for bicycle related projects and programs. This is someone you can reach out to directly with your questions and concerns. Some cities, such as Flagstaff and Tucson, have citizen bicycle committees. Many cities have a specific web page with this information.
Once your communities’ plans have been reviewed and understood, there are a number of approaches for improvement. While it would be best for communities to work on all the approaches listed below, resource limitations make this unrealistic.
One approach is to improve the existing bicycle network. This includes
- Updating all bike lanes in the network to follow the guidelines for lane width and separation
- Make sure that bike lanes don’t have gaps or just end, leaving riders in dangerous situations
- Make sure intersections where the network crosses major streets are set up for safe crossing
- Install a method for people on bicycles to activate traffic signal at signaled intersections
- Make sure there is sufficient signage to identify the bicycle network for riders and drivers
- Work with other communities so bicycle networks connect across jurisdictions
Another approach would be to develop a new bicycle network or expand the existing network. This could focus on creating or improving routes
- From high population areas to high employment areas
- In areas with low car ownership and/or high numbers of bicycle commuters
- For better connection with public transit
A third approach would be to focus on high crash intersections and corridors.
- Identify the most dangerous areas for people on bicycles
- Develop infrastructure changes that improve safety for all road users
Some of these approaches could overlap. For example, if the goal was to bring all bicycle lanes in compliance with guidelines from National Association of City Transportation Officials (NACTO), the bike lanes on the most dangerous corridors could be the priority.
A recent analysis by the Virginia Department of Transportation found that zero vehicle households and employment density were two of the strongest predictors of the locations of crashes between motor vehicles and non-motor vehicles. The number of zero vehicle households and employment density for all U.S. cities is available from the U.S. Census Bureau as part of the American Community Survey. In Maricopa County, the Maricopa Association of Governments (MAG) manages an interactive mapping website with census information; including population, employment, rate of car ownership, and transportation mode by zip code and census block. https://ims.azmag.gov/ This information is also available for all areas of Arizona through the U.S. Census Bureau using the Census Reporter and other Census tools. https://censusreporter.org/
Other pertinent traffic information is often available online. The City of Mesa updates their traffic counts annually at https://www.mesaaz.gov/residents/streets-transportation/traffic-counts, and provides a map showing posted speed limits at https://www.mesaaz.gov/home/showpublisheddocument?id=35998. Your community likely has this type of information available to help determine if the appropriate bicycle facilities are in place on your streets.
An interactive dashboard which includes a map of Arizona bicycle crash locations from 2015 to 2019 is located at https://public.tableau.com/app/profile/et.ratledge/viz/ArizonaTrafficCrashesInvolvingBicycles/AZBicycleCrashes.
If you are interested in how bicycle facilities should be designed, the Federal Highway Administration (FHWA), NACTO, and others offer a number of free resources for bikeway design and selection. These include the
- Urban Bikeway Design Guide https://nacto.org/publication/urban-bikeway-design-guide/
- Bikeway Selection Guide https://www.pedbikeinfo.org/pdf/Webinar_PBIC_032619.pdf
- On-street Motor Vehicle Parking and the Bikeway Selection Process https://safety.fhwa.dot.gov/ped_bike/tools_solve/docs/FHWA-SA-21-009_On_Street_Motor_Vehicle_Parking.pdf
- Traffic Analysis and Intersection Considerations to Inform Bikeway Selection https://safety.fhwa.dot.gov/ped_bike/tools_solve/docs/FHWA-SA-21-010_Traffic_Analysis_Intersection_Considerations.pdf
- Pedestrian and Bicyclist Road Safety Audit (RSA) Guide and Prompt List https://safety.fhwa.dot.gov/ped_bike/tools_solve/docs/fhwasa20042.pdf
- You can find a complete list of FHWA bicycle related publications at https://safety.fhwa.dot.gov/ped_bike/tools_solve/
The FHWA offers free Bicycle Facility Design training through its National Highway Institute. This training is open to anyone. https://www.nhi.fhwa.dot.gov/course-search?tab=0&typ=3&sf=0&course_no=142080
Regardless of your place in the bicycle community, rider, advocate, planner, engineer or elected official, you can participate in working to improve and expand the bicycle network. You can start reviewing the information available in your area and working with others to make your roads safer and more efficient for people on bicycle.
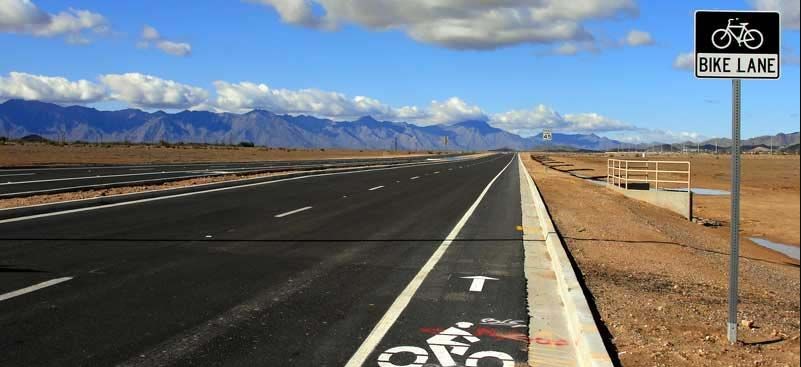
South Mountain Freeway Shared Use Path
— Path OPENED 10/30/2020 —
The South Mountain Freeway, the last and final portion of loop SR202, was constructed atop what was Pecos Road, in the Ahwatukee area of the city of Phoenix.
Although some form of path was seemingly promised as long ago as 2010, that was all seemingly forgotten by 2015 when preparations for the construction of the freeway were reaching final planning stages.
A group of local cyclists banded together, most notably the Pecos Action Group led by Joe Struttman, was well as Bob Beane of the Coalition, along with other stakeholders including elected officials from both the city and state to cause a shared use path to be built; and not just any path but a 20 foot wide asphalt path suitable for higher-speed cycling. Curves, bends, and dips were eliminated, which also has the side-effect of making the path all-weather; it will not flood in low spots during normal storms. Commitments were made finally in 2017 that this path would actually be constructed:
Shared Use Path running along the southern side of the 202- The final design will be completed shortly with direction to make it compatible with high speed bicycle use. This facility will be the first of its kind in the nation and is expected to bring cycling enthusiast from all around the state to our community. This started as an idea and has now transformed into what could be the first cycling park of this kind in the nation thanks to the collaboration of this group.
The path is approximately six miles long, spanning from 40th Street to 17th Avenue. Access the path from any of the following: 40th St, 32nd St, 24th St. Desert Foothills Parkway, or 17th Avenue. The path is runs along the south side of the freeway; to the south of the path lies the Gila River Indian Community; and offers great views of the Estrella Mountains to the west

The freeway connects the communities of Ahwatukee (and the east Valley) to Laveen (and the west Valley). Unfortunately, there are no feasible routes for bicyclists to commute between the two; it’s an effective dead end at 17th Avenue. The Coalition requested ADOT to evaluate a small section (between 17th Ave and Vee Quiva Way) in 2016, years before the freeway was opened. They inexplicably never conducted this evaluation; after over three years of waiting, in 2020 ADOT finally issued a written determination that does not follow their own policy and is arbitrary. We await an actual evaluation and decision based on facts and in keeping with their own policy. Until then, ADOT will continue to deny bicyclists the advantages and economic opportunities that access to this multi-billion dollar project — funded primarily from sales taxes — provides the motoring public.

.
See news item: ahwatukee.com: Remaining SM Freeway pieces opening Oct.19
…Both the interchange and the multi-use path have a long history that took a long time to iron out as the former was an off-again on-again component and the multi-use path the result of persistent lobbying by the high-speed bicycling enthusiasts.
For years, bicyclists across the Valley flocked to Pecos Road, which was considered a premiere training facility where they could cruise up and down hills while reaching speeds of up to 40 mph for stretches between traffic lights.
But it was a far from perfect place for cycling, given that motorists reached hit higher speeds. Two cyclists were killed in 2004 and 2014.
Cycling community leader Joe Struttmann saw the imminent disappearance of Pecos Road to make way for the freeway as a perfect opportunity to build a safe path for cyclists that would be the first of its kind in the country – and far safer than Pecos Road…